Google Program Manager Interview Question
How Top 1% Candidates Answer this in 2026?

If you think you can crack a Google Program Manager interview by talking about Gantt charts, Stakeholder management or Cross-functional alignment, you are setting yourself up for failure.
See this question recently asked in a Google PgM interview:
You are a Program Manager at Google working on Gemini. Recently, the number of downvotes on Gemini responses has increased significantly. How would you investigate the root cause of this issue, what metrics would you analyze and how would you decide what actions to take?
This is not a Project Management question. This is a diagnosis question.
Google is testing whether you can take an ambiguous signal (downvotes went up), decompose it systematically, identify root causes from noise and drive the right action without panicking and without jumping to solutions before understanding the problem.
Most candidates fail because they jump straight to “let us fix the model” without first understanding what broke, where it broke and for whom it broke.
We will see how to answer this question like the Top 1%.
First Principles Breakdown
First, let us break this down using First Principles Thinking and understand what we are actually dealing with.
Before investigating anything, you need to understand the mechanics of the signal itself. Ask three fundamental questions.
What is a downvote?
At its core, a downvote on Gemini is a user signal that says “this response did not meet my expectation.” It is the simplest form of explicit negative feedback.
But here is what most candidates miss. A downvote does not tell you what went wrong. It tells you something went wrong. The downvote is a symptom. It is not a diagnosis. A patient walks into a hospital with a fever. The fever is real. But the fever could be caused by an infection, dehydration, an autoimmune response, or a dozen other things. Treating the fever without diagnosing the cause is malpractice.
Same principle applies here. The downvotes increased. That is the fever. Your job is to find the infection.
Why do users downvote?
Users downvote for fundamentally different reasons. And each reason points to a completely different root cause.
The response was factually wrong. The response was irrelevant to the question. The response was too long or too short. The response tone was inappropriate. The response was slow. The response was repetitive or generic. The response failed to follow instructions. The response was offensive or biased. The response hallucinated.
Each of these is a different failure mode. Each requires a different investigation. Each leads to a different fix. A candidate who says “the model quality dropped” without distinguishing between these failure modes has not actually diagnosed anything.
Are there any constraints?
Yes. Three critical ones.
First, downvotes are noisy. Some users downvote because they are frustrated with AI in general. Some downvote because their expectation was unrealistic. Some downvote accidentally. Not every downvote represents a genuine quality failure.
Second, downvotes are biased toward certain user segments. Power users who interact with Gemini 50 times a day generate more feedback signals than casual users who try it once a month. A spike in downvotes could reflect a problem that only affects power users while casual users are perfectly happy.
Third, downvotes lack context. The user clicked thumbs down. They did not write a paragraph explaining why. You have the signal but not the reason. Your investigation must connect the signal to the reason using data, not assumptions.
Clarifying Questions
The question is broad. A strong candidate narrows the scope before investigating. Here are the clarifying questions you would ask the interviewer.
1. What is the timeframe?
When did the increase start? Was it a sudden spike (suggesting a specific event or release) or a gradual trend (suggesting a slow degradation)?
Let us assume the interviewer says it was a noticeable spike over the last one month. No seasonality
2. Is there a possible trigger?
Would like to understand when did this increase start? This helps us connect the problem to a possible trigger.
Let us assume the increase started after a model update last month, which suggests this may be related to a model or behavior change.
3. Is this global or segmented?
Is the increase happening across all user segments, all geographies, all query types? Or is it concentrated in specific areas?
Let us assume the interviewer says: “That is part of what you need to investigate.”
4. Is the issue specific to certain use cases?
Yes, the increase in downvotes is primarily in Coding and Technical queries, not in Writing or Summarisation.
Based on the clarifying questions, the increase in downvotes is being measured as downvotes per response and started right after a recent model update. The problem is seen across users but concentrated in ‘coding and technical use cases’, suggesting the recent model update may have reduced response quality or relevance in technical scenarios.
Our goal now is to identify the exact root cause behind this decline and determine what needs to be fixed to improve user satisfaction.
Approach
Here is where most candidates go wrong. They start listing possible causes randomly. “Maybe the model got worse. Maybe there is a bug. Maybe users changed.”
A Top 1% candidate does not guess. They investigate systematically using a structured decomposition.
Step 1: Identify Relevant Metrics
→ Core metric: Downvotes per response
→ Quality metrics: Accuracy, Task correctness, Hallucination rate, Regeneration rate
→ Relevance metrics: Follow-up question rate, Abandonment after first response
→ UX metrics: Response length, Scroll depth, Response Copy rate
→ Performance metrics: Latency, Timeout rate
→ Safety or policy metrics: Unsafe response rate, Refusal rate
Primary metric: Downvote rate (downvotes / total responses) segmented by time, category, user segment, geography, model version, and product surface.
Diagnostic metrics:
Refusal rate: Percentage of responses that contain safety-triggered refusals or hedging.
Hallucination rate: Percentage of responses flagged for factual inaccuracy. Response latency: p50, p90, p99 response times over the investigation period.
Response length distribution: Did average response length change? Too short or too long both trigger downvotes.
User retention: Are downvoting users returning, or are they churning? This tells you severity.
Qualitative data: Sample review of 200+ downvoted responses manually categorize the failure mode (wrong, irrelevant, too long, refusal, hallucination, tone, slow). User feedback comments if available alongside downvotes. Social media and forum sentiment about Gemini quality.
For detailed solution, check out the video →
Step 2: Formulate Hypothesis
We have identified the key metrics, the next step is to convert those metrics into testable hypotheses.
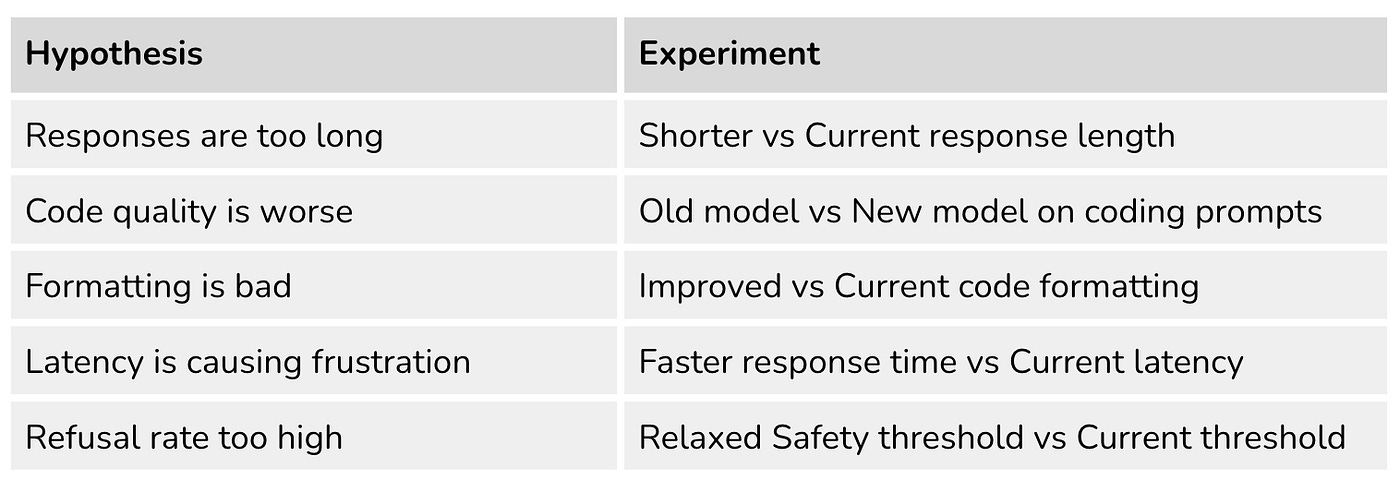
Formulate Hypothesis
Once you know where the spike is concentrated, ask what changed in that segment during the same timeframe.
Build a timeline of every change that happened in the last two weeks. Model updates. Prompt template changes. Safety filter adjustments. UI changes. Infrastructure migrations. Traffic pattern shifts. New feature launches. A/B test starts or stops. Policy updates.
Overlay this timeline with the downvote trend. Look for correlation.
Downvotes spiked on March 15. A new safety filter was deployed on March 14. Correlation found. Now you have a hypothesis: the new safety filter is causing the model to over-refuse or hedge excessively, leading to user frustration and downvotes.
Correlation is not causation. But it gives you a hypothesis to test. Without correlation, you are guessing.
Step 3: Isolate the root cause.
You have a hypothesis. Now prove or disprove it.
If the hypothesis is “the new safety filter is causing over-refusal,” test it directly. Pull a sample of 200 downvoted responses from after March 15. Manually review them. What percentage contain refusals or excessive hedging? Compare this to a sample of 200 responses from before March 15. Is the refusal rate significantly higher?
If yes, you have isolated the root cause. The safety filter is the problem.
If no, the safety filter is not the cause. Go back to the correlation timeline. Pick the next most likely event. Test that hypothesis.
This Segment-Correlate-Isolate cycle repeats until you find the root cause. It is not glamorous. It is not fast. It is how actual diagnosis works. At Google. At Amazon. At every company that takes quality seriously.
The Action Decision Framework
You have identified the root cause. Now what? This is where the Program Manager earns their salary. Because the action depends on the severity, the cause and the trade-offs.
If the root cause is following:
→ If old model for coding shows lower downvotes and higher correctness, propose routing coding queries to that model temporarily while ML team fixes regressions in the new one.
→ If shorter responses or better formatting significantly reduce downvotes, partner with UX and Engineering to roll out those changes broadly.
→ If latency is the main driver, prioritise infra/serving optimizations or routing coding tasks to a faster configuration.
Communication Plan
The Program Manager does not just investigate, they communicate. And the communication structure matters as much as the investigation.
Within 24 hours: Send a preliminary signal to Gemini leadership. “We have detected a x% increase in downvotes over the last one month. Investigation is underway. Initial segmentation suggests the spike is concentrated in [segment]. We have identified [number] potential root causes and are running targeted analyses. Full findings expected within 72 hours.”
This buys you time. Leadership knows you are on it. They know the scope. They know when to expect answers.
Within 72 hours: Deliver the root cause analysis. “The spike is caused by [root cause]. Here is the data. Here is the proposed action plan. Here is the expected timeline for resolution. Here is how we will measure whether the fix worked.”
Specific. Data-backed. Action-oriented. No hand-waving.
Within one week: Confirm the fix. “The [action] was deployed on [date]. Downvote rate has returned to baseline / decreased by X%. We are monitoring for regression. The underlying process change to prevent recurrence is [process change].”
Close the loop. Leadership trusts Program Managers who close loops. They do not trust ones who investigate forever and never confirm the outcome.
What Google is Actually Testing
Here is what most candidates miss about this question.
Google is not testing whether you know how LLMs work. They are testing three specific competencies.
Competency 1: Structured problem decomposition. Can you take an ambiguous signal and break it into investigable pieces? Follow a structured approach. Random guessing is not.
Competency 2: Data-driven decision making. Can you identify the right metrics, pull the right data and let the evidence guide your conclusions? Or do you jump to the first hypothesis that sounds plausible?
Competency 3: Action bias with appropriate caution. Can you drive toward a fix without cutting corners on diagnosis? Rolling back a model within hours shows urgency. Rolling it back without understanding why shows recklessness. Google wants the Program Manager who does both.
The candidate who demonstrates all three competencies gets the offer. The candidate who lists possible causes without a structured investigation gets a polite rejection.
If you like this breakdown, you will love our Program Manager Interview Mastery Course with real Program Manager Interview questions from Google, Amazon, Meta and AI startups with First Principle Approach & Case study walkthroughs and not just theory. The exact approach that gets offers. (32+ Videos & Extra 25+ Real Case studies as well )
About Author
Priyanka Dalmia! I help Business professionals, Consultants, Program Managers to become AI Native using First Principles Thinking.